Plateau Measurement
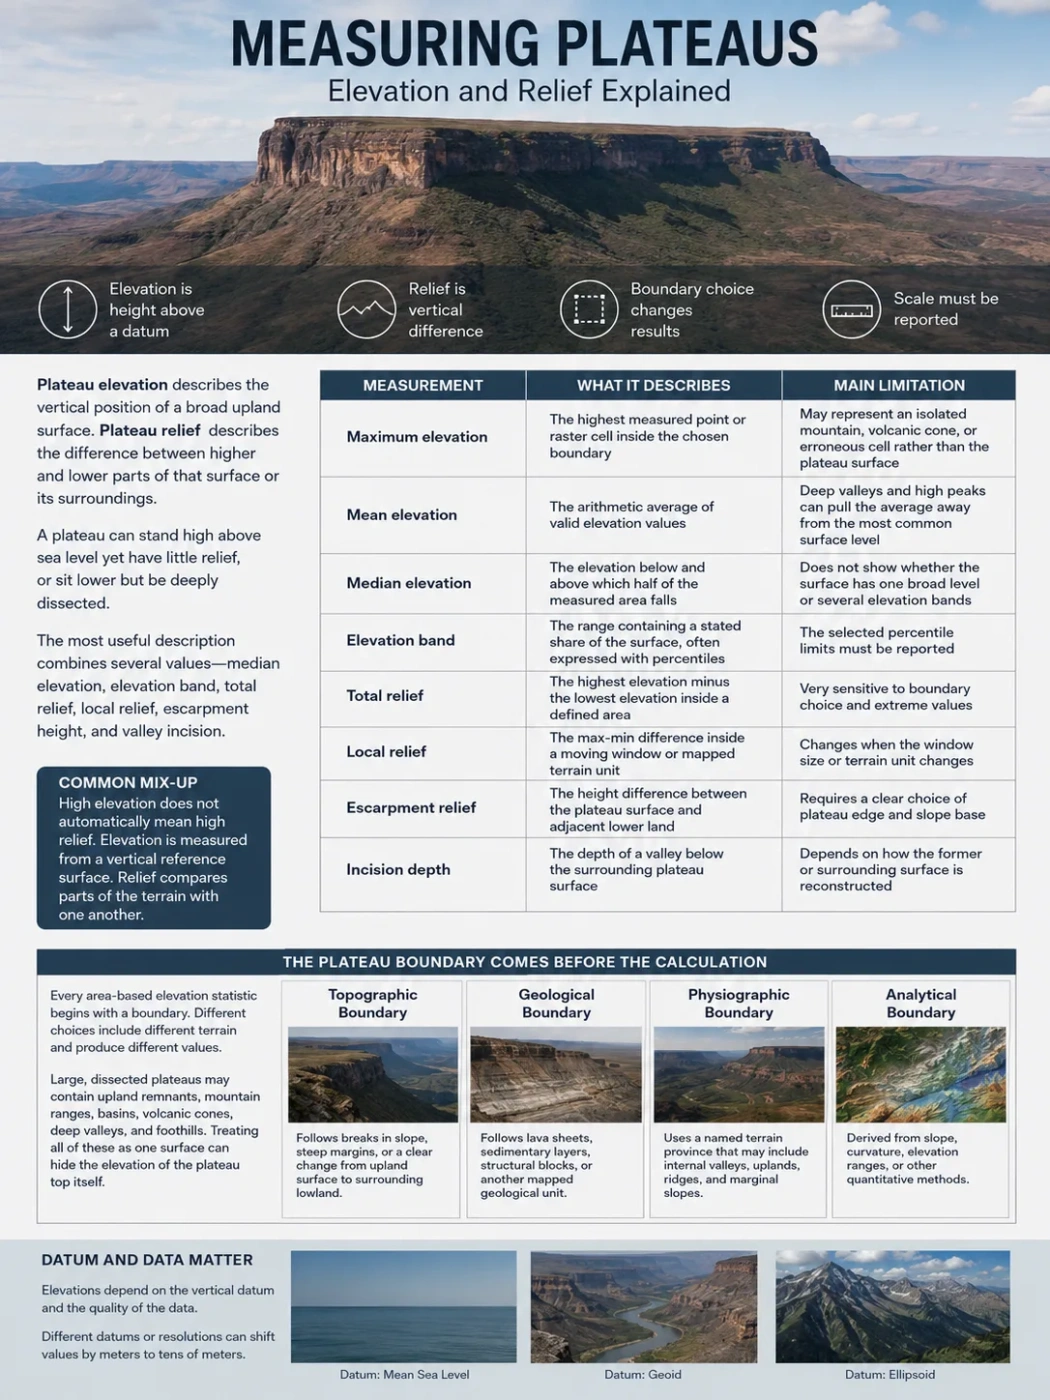
A plateau does not have one self-evident height. Its elevation depends on the surface being measured, the boundary drawn around it, the vertical datum used, and the way valleys, peaks, escarpments, and data errors are handled. Relief adds a second question: how much does the land rise and fall within a stated area?
Plateau elevation describes the vertical position of a broad upland surface. Plateau relief describes the difference between higher and lower parts of that surface or its surroundings. These measurements answer different geographic questions. A plateau may stand several kilometres above sea level yet have a broad, gently rolling interior. Another may sit at a lower absolute elevation but be cut by deep canyons and show much greater local relief.
The most useful description therefore combines several values rather than reducing an entire landform to a single number. Median elevation, the main elevation band, total relief, local relief, escarpment height, and valley incision can each describe a different part of the same plateau.
| Measurement | What It Describes | Main Limitation |
|---|---|---|
| Maximum elevation | The highest measured point or raster cell inside the chosen boundary | May represent an isolated mountain, volcanic cone, or erroneous cell rather than the plateau surface |
| Mean elevation | The arithmetic average of valid elevation values | Deep valleys and high peaks can pull the average away from the most common surface level |
| Median elevation | The elevation below and above which half of the measured area falls | Does not show whether the surface has one broad level or several separate elevation bands |
| Elevation band | The range containing a stated share of the surface, often expressed with percentiles | The selected percentile limits must be reported |
| Total relief | The highest elevation minus the lowest elevation inside a defined area | Very sensitive to boundary choice and extreme values |
| Local relief | The maximum-minus-minimum difference inside a moving window or mapped terrain unit | Changes when the window size or terrain unit changes |
| Escarpment relief | The height difference between the plateau surface and adjacent lower land | Requires a clear choice of plateau edge and slope base |
| Incision depth | The depth of a valley below the surrounding plateau surface | Depends on how the former or surrounding surface is reconstructed |
Common Mix-Up
High elevation does not automatically mean high relief. Elevation is measured from a vertical reference surface. Relief compares parts of the terrain with one another.
The Plateau Boundary Comes Before the Calculation
Every area-based elevation statistic begins with a polygon, even when that polygon is only implied. The line may follow a visible escarpment, a geological province, a drainage divide, a mapped physiographic unit, or a computer-derived change in slope. Different choices include different terrain and produce different values.
This issue is especially important for large, dissected plateaus. A named plateau may contain broad upland remnants, mountain ranges, enclosed basins, volcanic cones, deeply cut river corridors, and transitional foothills. Treating every feature within the regional name as one surface can hide the elevation of the plateau top itself.
Four Boundary Concepts Used in Plateau Studies
Landform Edge
Topographic Boundary
Follows breaks in slope, steep margins, or a clear change from upland surface to surrounding lowland.
Rock Units
Geological Boundary
Follows lava sheets, sedimentary layers, structural blocks, or another mapped geological unit linked to the plateau.
Regional Mapping
Physiographic Boundary
Uses a named terrain province that may include internal valleys, uplands, ridges, and marginal slopes.
Surface Analysis
Morphometric Boundary
Uses elevation, slope, curvature, relative height, or a combination of terrain measures to detect the upland surface.
A careful measurement states whether it covers the whole plateau region, the interior top surface, or only preserved surface remnants. Those are related areas, but they are not interchangeable.
What Usually Requires a Separate Decision
- Whether mountain summits rising above the plateau surface remain inside the analysis
- Whether deeply incised river valleys count as part of the plateau surface or as cuts through it
- Whether steep marginal slopes belong to the plateau polygon
- Whether enclosed basins are measured with the upland or as separate terrain units
- Whether isolated mesas and upland remnants still belong to the same plateau system
- How a gradual edge is treated when no sharp escarpment exists
Measurement rule: a plateau value without a stated boundary is not fully reproducible. Two reports can use the same elevation grid and still disagree because they measured different areas.
Elevation Must Refer to a Vertical Datum
Elevation is not simply “distance above the ocean.” Surveying and mapping use a defined vertical reference. For most land mapping, the useful value is orthometric height, which is measured upward from the geoid along the direction of gravity. The geoid is an uneven gravity-based surface that closely corresponds to mean sea level extended beneath the continents.
Satellite positioning systems first provide ellipsoidal height. This is measured from a smooth mathematical ellipsoid used to model Earth. Because the geoid and ellipsoid do not coincide, a raw GNSS height is not automatically the same as the elevation printed on a topographic map.
Elevation Note
The usual relationship is H = h − N, where H is orthometric height, h is ellipsoidal height, and N is the geoid height. The geoid model and vertical datum should be named whenever GNSS heights are converted into mapped elevations.
This distinction matters when plateau measurements from different countries or datasets are compared. A difference may come from the reference surface rather than from the land. Values should be transformed to a common vertical datum before small elevation differences are interpreted.
Vertical and Horizontal References Serve Different Jobs
| Reference Element | Question It Answers | Why It Matters |
|---|---|---|
| Horizontal coordinate reference system | Where is the point or raster cell? | Controls position, map projection, distance, area, and cell geometry |
| Vertical datum | From which zero surface is height measured? | Controls the numerical elevation assigned to the point |
| Geoid model | How is ellipsoidal height converted to elevation? | Provides the spatially varying separation between ellipsoid and geoid |
| Unit | Is height recorded in metres, feet, or another unit? | Prevents conversion and rounding errors |
How Elevation Data Are Collected
Plateau measurements may come from field surveys, aircraft, drones, radar satellites, optical stereo imagery, or existing topographic maps. The right source depends on the size of the plateau and the feature being measured. A continent-scale upland does not need the same data density as a narrow escarpment or a deeply incised valley.
| Method | What It Produces | Best Use on Plateaus | Common Limitation |
|---|---|---|---|
| Spirit leveling | Precise height differences tied to benchmarks | Vertical control and local engineering-grade checks | Slow across large or remote uplands |
| Survey GNSS | Accurate three-dimensional positions at selected points | Ground control, benchmark transfer, and DEM validation | Needs suitable observation methods and geoid conversion |
| Barometric altimetry | Approximate height from air pressure | Reconnaissance and field navigation | Weather and pressure changes can shift readings |
| Photogrammetry | Three-dimensional surface from overlapping images | Detailed mapping from drones, aircraft, or stereo satellites | Cloud, shadow, snow, weak image texture, and vegetation can affect results |
| Airborne lidar | Dense laser point cloud with surface and ground returns | Small valleys, escarpments, terraces, and bare-earth models | Coverage may be limited and processing choices affect the ground model |
| Radar interferometry | Wide-area elevation grids derived from radar phase differences | Regional and near-global plateau analysis | Vegetation, layover, shadow, snow, and steep slopes can alter the measured surface |
| Contour mapping | Lines joining places of equal elevation | Manual relief estimates and topographic profiles | Features smaller than the contour interval may not appear |
Global and regional elevation products make large plateau studies possible. The Shuttle Radar Topography Mission created a widely used radar-derived surface model. Copernicus DEM products include global grids commonly described as GLO-30 and GLO-90. Their nominal spacing is about one and three arc-seconds, often rounded to roughly 30 and 90 metres near the equator. Arc-second spacing is angular, so the east–west ground width of a cell becomes smaller toward the poles.
Copernicus global products use EGM2008 orthometric heights and are classed as digital surface models. That detail matters in forested plateaus or settled uplands because the represented height may include vegetation and built features rather than bare ground alone.
DEM, DTM, and DSM Describe Different Surfaces
The term digital elevation model is often used as a broad label for gridded height data. More precise terminology helps explain what a sensor or processed product actually represents.
Digital Terrain Model
- Aims to represent the bare-earth surface
- Usually removes trees, buildings, and other above-ground objects
- Better suited to geomorphology, drainage, valley depth, and slope analysis
- Quality depends on how ground points were identified and interpolated
Digital Surface Model
- Represents the upper reflecting or visible surface
- May include forest canopy, buildings, and infrastructure
- Useful for visibility, surface obstruction, and some landscape studies
- Can overstate ground elevation where vegetation is tall or dense
A raster can also contain flattened water surfaces, filled gaps, smoothed ridges, and edited shorelines. These changes may improve continuity while altering small terrain features. Product documentation should therefore be checked for void filling, resampling, water-body treatment, vegetation correction, and known artifacts.
Field Note
Finer cell spacing does not guarantee better elevation accuracy. Resolution describes the size or spacing of the samples. Accuracy describes how closely the recorded height matches the reference surface.
From a Plateau Polygon to a Representative Elevation
Once the target surface, boundary, dataset, and datum are fixed, GIS software can calculate elevation statistics across the polygon. A defensible workflow keeps the raw regional height range separate from the elevation of the main plateau surface.
Define the Measured Surface
State whether the analysis covers the whole physiographic region, the interior top, preserved remnants, or a selected subregion.
Prepare the Elevation Grid
Match coordinate systems, confirm units and vertical datum, clip the grid, and identify voids or implausible values.
Separate Terrain Components
Where needed, classify interior surface, escarpments, mountain peaks, enclosed basins, and incised valleys as separate units.
Calculate and Check Statistics
Report distribution measures, inspect profiles and maps, compare with control points, and record the scale of each relief calculation.
Why One Average Is Rarely Enough
The mean uses every valid grid cell, which makes it useful for area-wide calculations but sensitive to deep valleys and high summits. The median is less affected by isolated extremes and often gives a better sense of the central surface level in a dissected region.
Percentiles show how the plateau area is distributed through height. A 10th–90th percentile band, for example, describes the middle 80 percent of measured cells after the lowest and highest tails are set aside. This does not make the excluded terrain unimportant. It separates the dominant elevation band from extreme topography.
A histogram or hypsometric curve can reveal whether a plateau has one broad surface, several stepped levels, or a large share of low valley terrain. Two plateaus with the same mean elevation may have very different distributions.
| Statistic | Useful Question | Interpretive Caution |
|---|---|---|
| Minimum and maximum | What is the full measured height range? | Check whether both values belong to real terrain and to the intended surface |
| Mean | What is the area-wide arithmetic elevation? | Can be shifted by valleys, peaks, and unequal surface classes |
| Median | Where is the midpoint of the area distribution? | Does not show multiple elevation clusters by itself |
| Percentile band | Where does most of the surface lie? | The chosen percentile limits must be stated |
| Mode or dominant band | Which elevation interval covers the greatest mapped area? | Changes with bin width and raster resolution |
| Standard deviation or interquartile range | How dispersed are elevations around the centre? | Describes spread, not the spatial pattern of ridges and valleys |
Relief Changes with the Area Used to Measure It
Relief is usually calculated as the difference between a high elevation and a low elevation. The formula is simple. The geographic meaning depends on where those values are selected.
Total relief = maximum elevation − minimum elevation
Total relief across a broad plateau region may combine a summit, a canyon floor, and a marginal lowland. It describes the full vertical range of that polygon, not the everyday roughness of the plateau interior.
Local Relief Uses a Stated Window
Local relief is commonly calculated for each raster cell by finding the highest and lowest elevations inside a moving neighbourhood:
Local relief = window maximum − window minimum
A small window detects short gullies, low ridges, and minor surface breaks. A larger window begins to include main valleys, interfluves, and regional steps. The resulting map can change greatly even though the DEM remains the same.
| Measurement Scale | Terrain Most Likely to Appear | Typical Interpretation |
|---|---|---|
| Small neighbourhood | Minor channels, scarps, ridges, lava surfaces, terraces | Fine-scale surface roughness and incision |
| Intermediate neighbourhood | Valleys and adjacent interfluves | Local landscape relief |
| Large neighbourhood | Major canyons, mountain belts, broad plateau steps | Regional relief structure |
| Whole plateau polygon | Every included terrain component | Total elevation range, not local roughness |
The window must be reported in ground units, not only in raster cells. A 101-cell window covers a very different distance in a 1-metre lidar grid than in a 30-metre satellite grid.
Watershed Relief and Terrain-Unit Relief
A moving window is not the only option. Relief can be measured within a drainage basin, geomorphic unit, mapped valley, or plateau-surface polygon. These approaches follow natural terrain boundaries rather than a square or circular neighbourhood.
Watershed relief is useful when the aim is to connect topography with river incision and drainage. Terrain-unit relief is useful when the plateau contains separate surfaces formed or preserved under different geological conditions. Results from these methods should not be compared as though they used the same spatial support.
Escarpment Height Is a Profile Measurement
A plateau edge is best measured with several profiles drawn approximately perpendicular to the slope. Each profile identifies a representative upper surface, the break of slope, the steep face, and a lower reference surface. The vertical difference between the upper and lower surfaces gives escarpment relief.
Using only the highest and lowest cell near the edge can produce unstable results. A median or fitted elevation for the upper and lower surfaces usually describes the landform more reliably, especially where streams cut notches through the escarpment.
Valley Incision Is Not the Same as Plateau Relief
Incision depth compares a valley floor with the surrounding or reconstructed plateau surface. It records how far a river has cut below that surface. Total plateau relief may include the same valley, but it also includes other high and low terrain.
In strongly dissected plateaus, incision depth can be mapped by estimating a smooth surface across valley gaps and subtracting the actual DEM. The result depends on the smoothing method and on which upland remnants are treated as parts of the former surface.
Surface Tilt Can Imitate Relief
Many plateaus are not level. Their interiors may tilt gradually across tens or hundreds of kilometres because of tectonic deformation, regional uplift, warping, erosion, or the original slope of lava and sedimentary surfaces. A large elevation range can therefore come from steady tilt rather than from rugged terrain.
To separate the two, a plane or smooth trend surface can be fitted to the plateau top. Subtracting that trend from the original elevations creates a detrended surface. Positive residuals mark places above the broad trend; negative residuals mark valleys, basins, or lower surface patches.
Landform Note
Elevation range, surface tilt, relief, slope, and ruggedness are related but different. A gently tilted plateau can have a wide regional elevation range while retaining low local relief across much of its interior.
Measures That Should Remain Separate
| Terrain Measure | What It Captures | What It Does Not Show Alone |
|---|---|---|
| Elevation | Vertical position above a datum | Height relative to nearby land |
| Relief | Vertical range inside a stated area | Horizontal distance over which the change occurs |
| Slope | Rate of elevation change over horizontal distance | Total height range of the wider landscape |
| Ruggedness | Short-range variation among neighbouring cells or surfaces | A single universally accepted terrain meaning |
| Surface tilt | Broad directional rise or fall across the plateau | Small valleys and ridges after the regional trend is removed |
| Hypsometric integral | Where the mean elevation sits within the minimum-to-maximum range | The spatial arrangement of high and low terrain |
The elevation–relief ratio, often used as a form of the hypsometric integral, can be written as:
(mean elevation − minimum elevation) ÷ (maximum elevation − minimum elevation)
This dimensionless value describes the relative position of the mean within the total height range. It should not replace a map of local relief or a direct measure of escarpment height.
Resolution and Accuracy Affect Plateau Metrics in Different Ways
A DEM cell represents a sampled or modelled portion of the surface. When cell size becomes larger, narrow valleys may disappear, sharp escarpments may be smoothed, and high points may be lowered by averaging or interpolation. Minimum elevations may rise while maximum elevations fall, reducing measured relief.
Yet a fine grid may preserve noise, vegetation, buildings, quarry edges, road embankments, and processing artifacts. For a broad plateau, these features can create false local relief unless the terrain model is filtered and checked.
Horizontal Resolution
Horizontal resolution describes cell spacing or the smallest sampling interval represented by the grid. It controls how much spatial detail can be shown. It does not state how close each elevation is to the true ground height.
Vertical Accuracy
Vertical accuracy is evaluated against independent reference points or surfaces of higher known quality. Survey GNSS, lidar checkpoints, benchmarks, and carefully selected ground control may be used. Error should be checked across different elevations, slopes, land-cover types, and parts of the plateau rather than at a few convenient locations.
Relative Accuracy
For relief, relative vertical accuracy can matter as much as absolute elevation accuracy. A DEM may carry a broad vertical offset yet preserve local height differences reasonably well. Another may have acceptable regional elevation but smooth or distort short-range terrain variation.
Projection and Cell Geometry
Relief windows, slopes, areas, and profile distances are easier to interpret in a suitable projected coordinate system. Latitude–longitude grids use angular units. Their ground dimensions vary with latitude, which can make an apparently fixed cell or window cover different distances across a large plateau.
Do not compare relief values until the window size, grid resolution, surface type, projection, and boundary method are known. A higher number may reflect a larger analysis area rather than a more rugged plateau.
Measuring Plateau Relief from a Contour Map
Digital data are not required for a basic measurement. A topographic map can show plateau elevation, slope breaks, valley depth, and edge relief through contour lines and spot heights.
- Read the contour interval. This is the vertical difference between neighbouring contour lines.
- Identify the plateau surface. Look for broad areas crossed by widely spaced contours, often bounded by closer contours along steeper edges.
- Find reliable high and low values. Use labelled contours and spot elevations rather than visual shading alone.
- Separate the interior from the margin. A canyon floor or escarpment base answers a different question from the elevation of the upper surface.
- Draw a topographic profile. Mark each contour crossing along a line, transfer the elevations to graph axes, and connect the points smoothly.
- Calculate the chosen relief. Subtract the lower reference elevation from the upper reference elevation and state what the two points represent.
Contour spacing mainly indicates slope: close lines show rapid elevation change over a short horizontal distance, while wide spacing shows gentler terrain. The total relief still comes from the difference between labelled elevations.
The contour interval limits precision. If a summit has no spot height, its elevation lies above the highest closed contour but below the next possible contour level. Similar uncertainty applies to an unlabelled depression or valley floor.
Why Published Plateau Elevations Disagree
Different values do not always mean that one source is wrong. Plateau measurements often describe different surfaces, statistics, or reference systems. The wording around the number is as important as the number itself.
| Source of Difference | How It Changes the Result |
|---|---|
| Different plateau boundaries | Adds or removes mountains, valleys, basins, escarpments, and transitional terrain |
| Maximum used as “plateau elevation” | Replaces the broad surface level with the highest included point |
| Mean versus median | Changes sensitivity to deep valleys and isolated peaks |
| Whole region versus plateau top | Combines or separates the interior surface from margins and embedded terrain |
| DSM versus DTM | May include or remove canopy, buildings, and other surface objects |
| Different vertical datums | Changes the numerical zero surface used for elevation |
| Different grid resolutions | Changes the visibility of narrow valleys, sharp ridges, and extreme points |
| Different relief windows | Measures terrain variation at different geographic scales |
| Void filling and smoothing | Can soften escarpments, bridge gaps, or alter local highs and lows |
| Rounding and unit conversion | Creates smaller differences between values reported in metres and feet |
| Different acquisition dates | Can matter where mining, reservoirs, landslides, construction, ice loss, or erosion has changed the surface |
Data Note
An elevation value described as “average” should identify the measured area and averaging method. Without that information, it may refer to a mapped regional mean, a median grid elevation, a typical band, or a rounded descriptive estimate.
A Reporting Standard for Plateau Elevation and Relief
A reproducible plateau description records the decisions that shaped the result. The measurement should include enough detail for another reader to understand which land was measured and how the values were produced.
- Target surface: whole physiographic region, plateau interior, preserved surface, or named subregion
- Boundary method: mapped province, geological unit, escarpment, slope threshold, or manual interpretation
- Elevation dataset: product name, version where available, and acquisition or release context
- Surface type: DTM, DSM, or another terrain representation
- Horizontal detail: grid spacing and map projection
- Vertical reference: datum, geoid model, height type, and unit
- Distribution: minimum, maximum, mean, median, and selected percentile band
- Relief definition: total, local, watershed, escarpment, or incision relief
- Analysis scale: moving-window size or terrain-unit boundary
- Data treatment: voids, water, canopy, buildings, outliers, resampling, and smoothing
- Quality check: reference data, error measure, spatial coverage, and known weak areas
A clear geographic description might report that the interior surface is concentrated within a stated elevation band, while separately giving the full regional range, the median local relief at a named scale, the depth of major valleys, and the height of the outer escarpment. Each value then has a defined landform meaning.
Measurement Terms Used in Plateau Studies
Elevation
The vertical position of a point or surface above a named datum, commonly expressed as orthometric height above a geoid-based reference.
Relief
The vertical difference between higher and lower terrain within a stated area, window, profile, or landform unit.
Datum
A defined reference used to assign coordinates or heights. A vertical datum provides the zero surface for elevation.
Geoid
A gravity-based reference surface that closely follows mean sea level and continues beneath the continents.
Escarpment
A steep slope or cliff-like margin that separates a plateau surface from lower surrounding terrain or another surface level.
Hypsometry
The study of how land area is distributed by elevation, often shown with elevation histograms or hypsometric curves.
Incision
The cutting of valleys into an upland surface by rivers, glaciers, or related erosional processes.
Detrended Elevation
Elevation remaining after a broad fitted slope or smooth regional surface has been removed, helping separate local terrain from regional tilt.