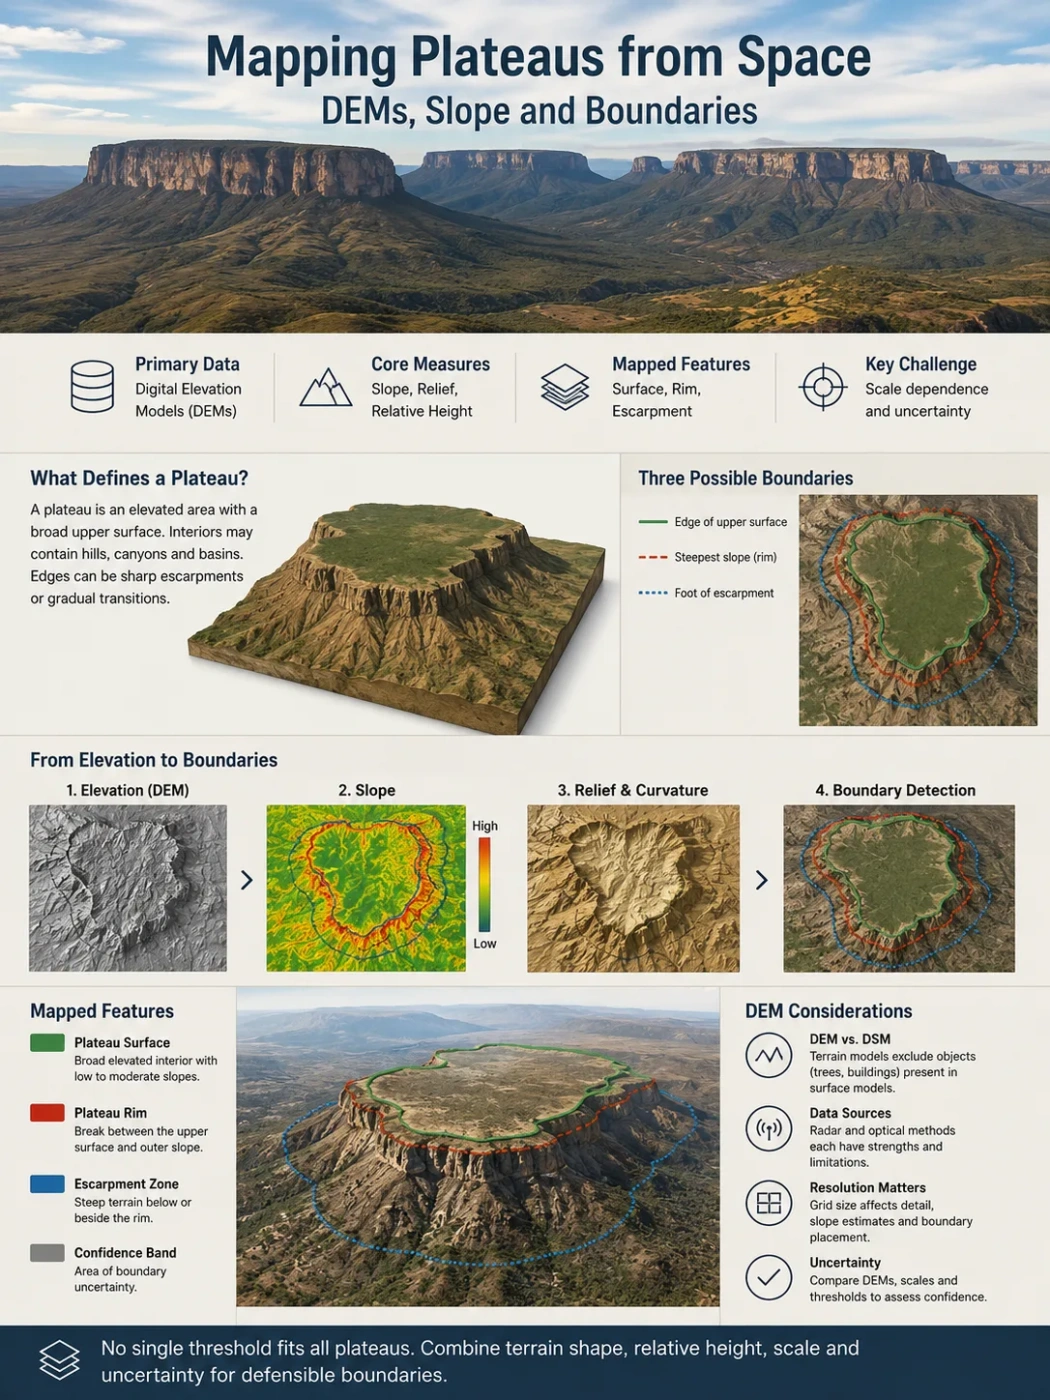
A satellite-derived elevation model does not contain a ready-made line labeled “plateau boundary.” It contains sampled heights. The plateau must be inferred from the spatial pattern of those heights: a broad raised surface, its relief and slope, the transition to surrounding terrain, and the scale at which the landform is being examined. This is why reliable plateau mapping usually combines a DEM with slope, relative elevation, local relief, terrain position and boundary validation rather than relying on one elevation threshold.
From Elevation Measurements to a Plateau Boundary
Satellite mapping turns topography into a raster: a regular grid in which each cell stores an elevation value. From that grid, GIS software can derive slope, curvature, relief, terrain position and other measurements that describe the shape of the land.
The important distinction is that elevation is observed or modeled, while the plateau boundary is interpreted. The raster can show where the ground rises and falls, but it does not decide which valleys belong inside a dissected plateau, whether a gentle outer slope marks the margin, or where an upland grades into an adjacent mountain belt.
A DEM or related elevation model provides the three-dimensional basis for the analysis.
Slope, relief, curvature and relative elevation describe how the surface changes across space.
Broad elevated areas with suitable terrain characteristics are separated from surrounding mountains, plains and basins.
Escarpments, gradual transitions, dissected margins and regional geomorphology are used to refine the mapped extent.
Profiles, hillshade, drainage, independent elevation data and known physiographic structure test whether the boundary is defensible.
Boundary Principle
A plateau boundary is normally a derived geomorphic boundary, not a feature directly measured by a satellite. A very precise-looking polygon can therefore represent an uncertain natural transition.
DEM, DSM and DTM Do Not Represent Exactly the Same Surface
The term digital elevation model, or DEM, is often used broadly for gridded elevation data. For plateau analysis, however, it matters what physical surface generated those elevation values.
DEM
A general term for a digital representation of elevation. Individual products may represent terrain, the upper reflective surface, or a processed combination of several elevation sources.
DSM
A digital surface model can include the tops of vegetation, buildings and other objects above the bare ground. The measured surface may therefore be rougher or higher than the underlying terrain.
DTM
A digital terrain model is intended to represent the terrain after features such as buildings and vegetation have been removed or reduced.
This difference becomes important when terrain derivatives are calculated. A forest canopy can add small-scale height variation to a plateau that is comparatively smooth at ground level. Buildings can create artificial local slopes. If those variations are treated as geomorphology, the calculated surface roughness may be higher than the actual terrain roughness.
Copernicus GLO-30 and GLO-90, for example, are digital surface models. They are derived primarily from TanDEM-X radar observations acquired between 2011 and 2015 and represent the top reflective surface, with editing applied to water bodies, coastlines and several other problematic features. They should not be treated as bare-earth terrain models simply because they are commonly described under the broader DEM label.
Surface Model Note
A 30 m elevation product can have fine spatial sampling while still containing vegetation or building height. Grid spacing and surface type describe different properties of the data.
Choosing an Elevation Dataset for Plateau Mapping
The best dataset depends on the size of the plateau, latitude, vegetation cover, required level of detail and whether the study needs a surface model or a closer approximation to bare terrain. Several widely used global products can support plateau-scale analysis, but they are not interchangeable.
| Dataset | Nominal Sampling | Surface | Useful Role | Main Mapping Consideration |
|---|---|---|---|---|
| Copernicus GLO-30 | 1 arc-second, roughly 30 m | DSM | Detailed global and regional terrain analysis | Vegetation and built structures can remain in the surface; use quality information where relevant. |
| Copernicus GLO-90 | 3 arc-seconds, roughly 90 m | DSM | Large regional and continental-scale analysis | Smaller escarpments, valleys and narrow remnants are more generalized. |
| NASADEM | 1 arc-second, about 30 m | Reprocessed SRTM-derived elevation model | Independent comparison and regional geomorphometry | Coverage extends from about 60° N to 56° S rather than the entire global land surface. |
| ALOS AW3D30 | 1 arc-second, roughly 30 m | DSM | Alternative global surface model for comparison and terrain analysis | Source and filling characteristics can vary, so suspicious edges should be checked rather than assumed to be real terrain. |
| FABDEM V1.2 | 1 arc-second, roughly 30 m at the equator | Forest- and building-reduced elevation model derived from Copernicus GLO-30 | Useful where canopy and building bias interfere with terrain interpretation | Its CC BY-NC-SA 4.0 license restricts commercial use, so licensing must be considered separately from technical suitability. |
NASADEM is based on the Shuttle Radar Topography Mission observations collected in February 2000, but it is not simply the original SRTM grid under another name. The product was reprocessed using additional elevation information and control data to improve geolocation and fill gaps.
AW3D30 is another useful comparison surface. Its current Version 4.1 product is a global 30 m-class DSM. Comparing two independently produced elevation models can expose suspicious steps, void-filling artifacts or surface differences that might otherwise be mistaken for a geomorphic boundary.
For very large plateaus, a 90 m grid may preserve the regional form while suppressing some local noise. For narrow escarpments, deeply incised margins or small plateau remnants, a 30 m-class product usually retains more useful detail. Higher nominal resolution does not automatically produce a better regional classification if the analysis scale is poorly chosen.
Arc-seconds are angular spacing, not a fixed ground distance everywhere. One arc-second is often described as roughly 30 m, but east-west ground spacing decreases with latitude. Raster dimensions and derivative calculations therefore need proper coordinate handling.
Why a Fixed Elevation Threshold Cannot Define a Plateau
A rule such as elevation > 1,500 m can isolate high terrain, but it cannot reliably isolate plateaus. The selected cells may include mountain ridges, volcanoes, high basins and steep massifs while excluding lower plateaus that rise clearly above neighboring plains.
The problem is relational. Plateau identity depends partly on how a broad surface sits relative to the surrounding landscape. There is no worldwide minimum elevation above sea level that separates every plateau from every non-plateau.
Absolute Elevation
- Measures height against a vertical reference datum.
- Useful for describing how high a surface stands above sea level.
- Cannot by itself distinguish a high basin from an elevated plateau.
- Can miss comparatively low plateaus above still lower surrounding terrain.
Relative Topography
- Compares a cell or surface with its wider neighborhood.
- Shows whether terrain stands above nearby plains, basins or valleys.
- Can help separate broad uplands from locally high peaks.
- Changes with the size of the neighborhood used for comparison.
A more useful question is therefore not simply “How high is this cell?” but “How high is this broad surface compared with the terrain around it, and what is the shape of that surface?”
Slope Reveals Surface Texture and Plateau Margins
Slope measures the rate of elevation change across horizontal distance. In a raster, it is calculated from neighboring elevation cells rather than from elevation alone. A common mathematical form is:
Slope Relationship
Slope angle = arctan(√[(dz/dx)2 + (dz/dy)2])
The exact implementation depends on the GIS algorithm and the way neighboring cells are sampled. A widely used approach estimates the gradients from a 3 × 3 neighborhood around each cell.
Slope is useful because many plateau interiors contain extensive areas of lower or moderate gradient compared with steep escarpments or deeply incised valleys. A transition from a broad, relatively subdued surface to a persistent belt of steep slopes can help locate a plateau margin.
But low slope does not mean plateau. Plains, basin floors, lake surfaces and valley bottoms can all have low slope. Conversely, parts of a genuine plateau can be steep where rivers have cut canyons through its surface.
Low slope and comparatively low regional elevation
Rapid elevation change and high slope
Broad elevated terrain with lower regional surface gradients
High local slope inside the wider plateau region
The broader elevated surface continues beyond the valley
Degrees and Percent Slope Must Be Kept Separate
Slope can be reported as an angle or a percentage. These values are not numerically interchangeable. Percent slope is calculated as tan(slope angle) × 100. A 45° slope is therefore a 100% slope, while a 20% slope is only about 11.3°.
Any plateau classification using a slope cutoff should state the unit. A threshold written only as “20” is ambiguous.
Breaks in Slope Can Mark an Edge Better Than Slope Alone
The interior of a plateau and the surrounding lowland can both contain gentle terrain. The useful signal may lie between them: the break in slope where the land begins to descend more rapidly.
A sharp escarpment can produce a narrow belt of high slope between the elevated surface and the lower terrain. This makes the outer margin relatively easy to trace. Other plateaus descend through broad foothills or rolling uplands, producing no single sharp line.
Curvature can help in these cases because it describes changes in the shape of the slope. Convex shoulders near the top of an escarpment, concave footslopes and other changes in gradient can supplement the basic slope raster. Curvature is most useful as supporting evidence rather than as a universal plateau detector.
A persistent steep slope separates a broad upper surface from clearly lower terrain. The topographic boundary can often be mapped with relatively high confidence.
Elevation declines over a broad zone without one dominant break. A transition belt is often more defensible than a single supposedly exact line.
The plateau meets rugged high terrain rather than a low plain. Elevation and slope alone may not distinguish the plateau domain from the surrounding mountain system.
Relative Elevation Shows Whether the Surface Is Regionally Raised
Relative elevation compares a location with its surrounding terrain rather than with sea level. One simple form subtracts a neighborhood elevation statistic from the elevation of the central cell:
Relative Elevation Concept
Relative elevation = cell elevation − regional neighborhood elevation
The neighborhood could be represented by a mean, median, smoothed regional surface or another suitable statistic. The exact method changes the result, so the calculation should match the scale of the landform.
This approach can reveal a broad tableland only 700 m above sea level if surrounding terrain lies near 200 m. It can also prevent a high basin from being classified as a plateau core merely because every cell lies above 2,500 m.
A related technique is the Topographic Position Index. It compares a cell’s elevation with the mean elevation of its neighborhood. Positive values indicate a cell above its surroundings, negative values indicate a lower position, and values near zero can describe either a flat area or a location on a constant slope. Combining terrain position with slope helps separate those cases.
Scale Matters
Terrain position is not an intrinsic label attached to a cell. A location can appear as a local ridge within a small neighborhood but form part of a broad plateau surface when examined across tens of kilometres.
Local Relief Separates Broad Uplands From Rugged High Terrain
Two regions can have similar average elevation and very different landform character. A broad plateau surface may contain comparatively modest vertical variation, while a mountain range at the same elevation can alternate repeatedly between deep valleys and high ridges.
Local relief measures that vertical range within a defined neighborhood:
Local Relief
Local relief = maximum elevation − minimum elevation within the analysis window
Low or moderate relief across an elevated area can help identify a plateau surface. High relief may indicate mountains, deeply dissected terrain, or the plateau margin. The measurement is especially useful when paired with slope because the two describe different aspects of terrain form.
The size of the calculation window is decisive. A small window emphasizes individual gullies and ridges. A larger window measures valley-to-ridge relief across a landscape. Regional plateau studies have therefore used relief windows ranging from kilometres to tens of kilometres depending on the feature being investigated.
There is no correct worldwide neighborhood size. A window that captures an entire small tableland could be far too small to characterize a plateau extending hundreds of kilometres.
Plateau Detection Is Inherently Multiscale
A plateau can be rugged at one scale and comparatively smooth at another. The Colorado Plateau contains deep canyon systems, yet the larger region retains a broad elevated physiographic identity. High plateaus can contain volcanoes, mountain ranges and basins without losing their regional plateau character.
This creates a scale problem for automated classification. A small neighborhood may classify canyon walls as steep terrain, valley floors as low terrain and mesa tops as isolated flat areas. A much larger neighborhood can reveal that all of these features lie within one regional elevated surface.
Local Scale
Emphasizes individual slopes, gullies, ridges, scarps, small valleys and topographic noise.
Landscape Scale
Reveals the continuity of plateau surfaces, major valleys, escarpment belts and broader relief patterns.
Regional Scale
Shows whether the landform forms a broad elevated domain relative to surrounding plains, basins or mountain provinces.
A useful workflow often calculates terrain measures at more than one scale rather than forcing every decision through a single raster neighborhood. Multiscale analysis is particularly important for large dissected plateaus, where local terrain can look mountainous even though the broader topographic form remains plateau-like.
The Plateau Surface Is Not the Same as the Plateau Region
This distinction prevents one of the most common errors in DEM-based plateau mapping.
Suppose a river has cut a canyon hundreds of metres below the surrounding plateau surface. The canyon floor is clearly not part of the surviving high surface. If every low or steep cell is removed, however, the plateau polygon becomes divided into many fragments even though the canyon lies inside the wider physiographic region.
Broad, elevated terrain that most clearly retains the geomorphic characteristics used to identify the plateau.
Canyons, river valleys, ridges and other terrain cut into or rising through the wider plateau domain.
The outer transition from the plateau domain toward lower or geomorphically different terrain.
A mapping project can therefore produce two legitimate but different outputs:
- Plateau surface mask: cells representing the surviving or characteristic elevated surface.
- Plateau regional boundary: a broader geomorphic domain that can include internally incised valleys and other subordinate terrain.
Neither should be substituted for the other without stating what is being mapped.
Dissected Plateaus Are a Difficult Automated Mapping Case
River incision can transform a once-continuous raised surface into a complex mosaic of ridges, interfluves, mesas, valley walls and canyon floors. A cell-by-cell classification based only on slope can then make the plateau appear to disappear precisely where erosion has cut deepest.
The broader landform may still be identifiable through repeated high surfaces, similar summit levels, regional elevation, drainage organization and the geometry of the surrounding margin. This is why strongly dissected plateaus often require a regional interpretation above the raw terrain classification.
Removing every steep cell from the plateau mask creates another problem: narrow river valleys can split one physiographic region into hundreds of polygons. GIS operations such as eliminating tiny isolated regions, filling small internal gaps or joining nearby surface fragments can make a classification more coherent, but those operations must be applied cautiously.
Polygon cleaning cannot substitute for geomorphology. Closing a gap in a classification mask may be reasonable when a narrow canyon fragments a known regional surface. Smoothing away a real mountain belt or broad basin simply to obtain a neat polygon is not.
Plateaus and Mountain Ranges Need More Than an Elevation Test
Mountain belts and plateaus often overlap in altitude. Some plateaus are surrounded by mountains, and some contain mountain ranges within them. The useful distinction is therefore based on the spatial form of the terrain, not a contest over which landform is higher.
| Terrain Property | Plateau Tendency | Mountain-Dominated Tendency |
|---|---|---|
| Regional elevation | Raised | Often raised |
| Surface continuity | Broad elevated domain | Narrower ridges, ranges or repeated peaks |
| Local relief | Often lower across the core surface | Often high across much of the terrain |
| Slope distribution | Large areas of lower or moderate slope may survive | Steep terrain is commonly more pervasive |
| High-relief belts | May concentrate at margins or along incised valleys | Can repeat throughout the region |
| Regional shape | Extensive raised surface or set of related surfaces | Linear, branching or clustered high-relief topography may dominate |
These are tendencies rather than a universal classification table. The Tibetan Plateau demonstrates why rigid rules fail: it contains broad high surfaces, major internal basins, deeply dissected eastern terrain and some of Earth’s largest mountain systems along its margins.
Building a Candidate Plateau Mask
A defensible raster workflow normally combines several terrain signals. Exact thresholds should be calibrated to the region and analysis scale rather than copied from another plateau.
Prepare the Elevation Surface
Check the elevation product, horizontal coordinates, vertical reference, voids, water editing and visible artifacts before calculating terrain derivatives.
Measure Terrain Form
Calculate slope and, where useful, local relief, relative elevation, terrain position, curvature or surface roughness at scales appropriate to the plateau.
Identify the Broad Raised Surface
Look for spatially continuous terrain that is regionally elevated without requiring every cell to be flat or every point to exceed one absolute elevation.
Refine the Margin
Use persistent changes in slope, relief, curvature and regional elevation to distinguish plateau interior, transition zones and surrounding terrain.
Test the Result
Inspect topographic profiles, hillshade, drainage patterns, alternate DEMs and regional geomorphology before treating the polygon as a meaningful boundary.
Why a Single Weighted Formula Is Not Universal
A classification can assign scores to terrain variables—for example, higher scores for regional elevation contrast and surface continuity, with lower scores for persistent high relief. Such a model can produce categories such as probable plateau core and transitional margin.
The weights cannot be assumed to work everywhere. A volcanic tableland with a sharp escarpment has a different terrain signature from a high intermontane plateau or an ancient, deeply eroded upland. An algorithm calibrated on one type may systematically misclassify another.
Machine Learning Does Not Remove the Definition Problem
A machine-learning classifier can combine DEM elevation, slope, curvature, relief, imagery and other raster layers. It can also recognize combinations that are difficult to express through simple thresholds.
It still needs a target definition. If training polygons were drawn according to one interpretation of a plateau boundary, the model learns that interpretation. Greater computational complexity does not turn a disputed or gradual geomorphic margin into an objectively unique line.
Satellite Imagery Helps Interpret the DEM, but Does Not Replace It
Optical and radar imagery can add information that a height grid does not contain. Exposed rock, vegetation transitions, drainage, lava surfaces and erosional patterns may help explain why a suspicious topographic edge appears in the DEM.
Imagery is especially useful for checking whether a terrain signal could be caused by land cover. A forest boundary, dense urban area or surface-water feature may coincide with a change in a DSM even when the underlying bare terrain changes much less.
Land-cover boundaries should not automatically become plateau boundaries. A plateau can cross forests, deserts, farms and urban areas without changing its geomorphic identity. The terrain model remains the main geometric source for elevation-based delineation.
Resolution Controls Detail, Not the Truth of the Boundary
A common mistake is to assume that a 30 m DEM makes the final plateau boundary accurate to about 30 m. Pixel spacing describes how densely the elevation surface is sampled. It does not describe all uncertainty in the derived landform boundary.
Boundary position can also be affected by:
- vertical elevation error;
- horizontal geolocation error;
- vegetation and buildings in a DSM;
- void filling and other elevation-source substitutions;
- the slope algorithm;
- resampling;
- the size of relief and terrain-position windows;
- chosen classification thresholds;
- polygon smoothing;
- and the real width of the geomorphic transition.
Copernicus GLO-30, for example, has a nominal 1 arc-second grid and published accuracy characteristics that are separate from its grid spacing. The derived plateau polygon introduces another layer of uncertainty because it depends on how terrain measurements are interpreted.
Pixel size ≠ boundary accuracy. A finely sampled raster can still produce an uncertain landform boundary, especially where the plateau grades gradually into neighboring terrain.
Coarser Data Can Change the Shape of the Edge
A 90 m grid smooths more local detail than a 30 m grid. Narrow ravines, short scarps and small remnants may disappear or merge into the surrounding terrain. The resulting boundary can be simpler even when both products represent the same regional landform.
That simplification is not always undesirable. For a continent-scale plateau inventory, retaining every 30 m incision can create detail finer than the purpose of the map. Resolution should therefore be selected together with the intended mapping scale.
Projection and Vertical Datum Affect Terrain Calculations
Elevation differences become slope only after they are related to horizontal distance. This matters because many global DEMs are distributed in geographic coordinates, where horizontal positions are stored in degrees rather than metres.
Copernicus GLO-30 and GLO-90 DGED products use geographic WGS 84 coordinates and elevations referenced vertically to EGM2008. A slope calculation must account correctly for the real horizontal spacing of cells. Treating one degree of latitude or longitude as though it were one metre would produce meaningless terrain derivatives.
At higher latitudes, one degree of longitude represents a much shorter east-west distance than it does near the equator. Software that supports geodesic terrain calculations can account for this directly. Another approach is to work in a suitable projected coordinate system for the region, with careful resampling and consistent elevation units.
Datum Check
Two elevation datasets can use different vertical reference surfaces. A systematic elevation offset caused by datum differences should not be interpreted as a real difference in plateau height.
DEM Artifacts Can Produce False Edges
Plateau detection is unusually sensitive to elevation artifacts because the analysis often searches for changes in slope, roughness or relative height. A small systematic error can become much more visible after a derivative such as slope is calculated.
DSM Effect
Forest Canopy
Tree height can increase apparent elevation and roughness. The effect becomes more noticeable when comparing forested terrain with adjacent open land.
DSM Effect
Buildings and Infrastructure
Dense built surfaces can add small artificial gradients that have little relation to the underlying landform.
Processing Effect
Water Flattening
Edited lakes and reservoirs can appear perfectly flat. Their shorelines should not be mistaken automatically for natural breaks in plateau morphology.
Source Effect
Void Filling
Missing data may be filled from another elevation model. A change in source can create texture or accuracy differences within one DEM product.
Sensor Effect
Radar or Stereo Artifacts
Steep terrain, snow, poor image matching or complex viewing geometry can reduce elevation quality in particular landscapes.
Hillshade is one of the simplest checks for these problems. Tile seams, abrupt textural changes, unnatural stripes and suspicious steps are often easier to recognize in shaded relief than in a colored elevation raster.
Smoothing Can Clarify a Plateau or Erase Its Edge
Raw 30 m elevation data contain far more local variation than many regional plateau studies need. Smoothing or calculating terrain statistics over a larger neighborhood can suppress small ridges, gullies, buildings and other features so that the broad raised surface becomes easier to identify.
Too much smoothing creates the opposite problem. Escarpments become wider and gentler, narrow valleys disappear and real terrain breaks can shift. A heavily smoothed DEM may make a plateau look more regular than the actual landscape.
Preserves local valleys, ridges, surface objects and noise.
Suppresses details smaller than the landform being mapped while retaining major margins.
Can weaken escarpments, merge separate features and shift the apparent plateau edge.
The appropriate amount of generalization should follow the mapping question. A global plateau inventory and a study of one escarpment should not use the same spatial filter simply because they start with the same DEM.
Different Plateau Forms Create Different Detection Problems
The combination of terrain metrics should follow the morphology of the plateau rather than a fixed worldwide recipe.
High Intermontane Plateau
Absolute elevation may provide little separation because adjacent mountain ranges are equally high or higher. Broad surface continuity, basin structure and regional relief become more informative than a simple elevation cutoff.
Deeply Dissected Plateau
Valleys and canyon walls create extensive steep terrain inside the plateau. Multiscale relief and reconstruction of the broader elevated surface are needed to avoid fragmenting the regional landform.
Escarpment-Bounded Tableland
The absolute elevation may be modest, but relative elevation and a strong peripheral break in slope can make the plateau edge comparatively distinct.
These differences explain why a threshold developed for a high, weakly dissected interior surface can perform poorly on an old erosional plateau with deep drainage or a low tableland bordered by a prominent escarpment.
A Boundary Can Be a Zone Instead of a Line
GIS polygons encourage a false sense of precision because every region must end at a specific sequence of coordinates. Natural plateau margins do not always behave that way.
A cliff or sharp escarpment can provide a narrow and repeatable boundary. A broad piedmont, rolling upland or transition into mountain terrain may extend across many kilometres. Different reasonable criteria can then place the line at different positions inside the same transition.
| Boundary Confidence | Typical Terrain Evidence | Recommended Interpretation |
|---|---|---|
| High | Persistent escarpment or strong elevation break supported by slope, relief and profiles | A relatively narrow boundary can be defensible. |
| Moderate | Consistent regional transition but no single dominant break | The mapped line represents one reasonable position within a broader geomorphic change. |
| Low | Mountain-framed margin, heavy dissection, broad piedmont or competing physiographic interpretations | A transition zone or explicitly uncertain boundary is preferable to artificial precision. |
Confidence can also vary around one plateau. One side may end at a distinct escarpment while another grades slowly into neighboring uplands. Assigning one uncertainty value to the entire polygon can hide that variation.
Topographic Profiles Are a Strong Test of the Detected Edge
A two-dimensional map shows where an algorithm places a line but may not show why. An elevation profile drawn across the proposed margin exposes the geometry directly.
Lower regional elevation and often lower relief.
Elevation begins to rise and slope steepens.
A change in gradient may identify the upper or lower edge of an escarpment.
Elevation remains regionally high across a broad distance despite local variation.
Several profiles should cross different parts of the margin. A boundary that appears convincing on one steep side may be poorly supported on another side where the terrain descends gradually.
Profiles are also useful for detecting incorrect thresholds. If an algorithm places the plateau edge halfway across a broad flat lowland, or cuts through a continuous upper surface because of a small valley, the error becomes easy to see in cross-section.
Drainage Provides an Independent Check on Surface Geometry
Rivers do not define every plateau, but drainage can reveal whether a proposed boundary makes geomorphic sense. Streams may cut headward into an escarpment, flow outward from a broad elevated region, cross the plateau in deep canyons, or drain internally into high basins.
A deeply incised river should not automatically split a plateau regional boundary simply because its channel lies hundreds of metres below the neighboring surface. Conversely, a broad basin or drainage divide can expose an incorrect assumption that two elevated surfaces belong to one continuous plateau.
Drainage is most useful as a validation layer alongside elevation and terrain derivatives. It provides another view of how the landscape is organized without reducing plateau identity to one hydrologic pattern.
Validating a Satellite-Derived Plateau Boundary
Automated classification becomes a geographic interpretation only after the result is checked against the terrain it is supposed to represent.
Cross the proposed boundary at several locations and examine whether the expected regional elevation transition is actually present.
Check escarpments, drainage incision, DEM seams and unexpected terrain texture that may not be obvious in a classified raster.
Compare important margins with another elevation product. A feature present in only one surface deserves closer inspection.
Examine major rivers, canyon systems and drainage divides for evidence that the interpreted regional surface is coherent.
Compare the derived extent with geological and geomorphological understanding of the region without assuming an existing map must be exact.
Change neighborhood sizes or reasonable thresholds and identify sectors where the mapped margin moves substantially.
Sensitivity testing is particularly informative. A boundary that remains in nearly the same place under several reasonable parameter choices is more strongly constrained by the terrain than one that shifts tens of kilometres when the analysis window changes slightly.
Ice-Covered Plateaus Require a Different Surface Definition
The Antarctic Plateau exposes an important limitation in the phrase “terrain elevation.” Across Antarctica, the visible high surface is largely the surface of the ice sheet, while the underlying bedrock has a different elevation and relief pattern.
A satellite DEM representing the upper ice surface can therefore be appropriate for mapping the ice-surface Antarctic Plateau, but it does not map the buried bedrock landform beneath the ice. Those are different physical surfaces and require different elevation datasets.
Ice-Surface Mapping
- Uses elevation of the present ice-sheet surface.
- Describes the broad high interior visible in surface topography.
- Slope and relief refer to the ice surface.
Bedrock Mapping
- Uses modeled elevation beneath the ice.
- Describes buried basins, mountains and bedrock terrain.
- Cannot be substituted directly for the visible plateau surface.
A global plateau-detection method should therefore state what physical surface it intends to classify before applying the same rules to ice-covered Antarctica and exposed continental terrain.
What a Mapped Plateau Boundary Actually Represents
A well-constructed satellite-derived plateau boundary represents a particular geomorphic interpretation at a stated spatial scale. Its position depends on the elevation surface, terrain derivatives, neighborhood sizes, treatment of internal dissection and the criteria used to separate the plateau from adjacent terrain.
For a sharp escarpment, several independent measurements may converge on almost the same edge. Elsewhere, the appropriate geographic representation may be a broad transition zone containing several defensible boundary positions rather than one uniquely correct line.
This distinction is especially important when plateau area is calculated from the final polygon. Changing the boundary rule changes the measured area. Area estimates from different maps are comparable only when their underlying definition, scale and treatment of uncertain margins are sufficiently similar.
Mapping Rule
The strongest plateau maps make the distinction between measured elevation, derived terrain metrics and interpreted landform boundaries explicit. That prevents the precision of the raster or polygon from being mistaken for certainty about where the natural plateau ends.